Separate wheel demand from motor selection
Wheel torque follows force × wheel radius / driven wheels. A motor rating additionally needs reduction ratio, speed, losses and the complete duty trace.
Reproducible method below AMRDriveUnit
Free concept sizing tool + engineering guide
Estimate AMR wheel torque, speed and DC demand for custom drive system design. Adjust the example below, then use the guide to plan component validation.
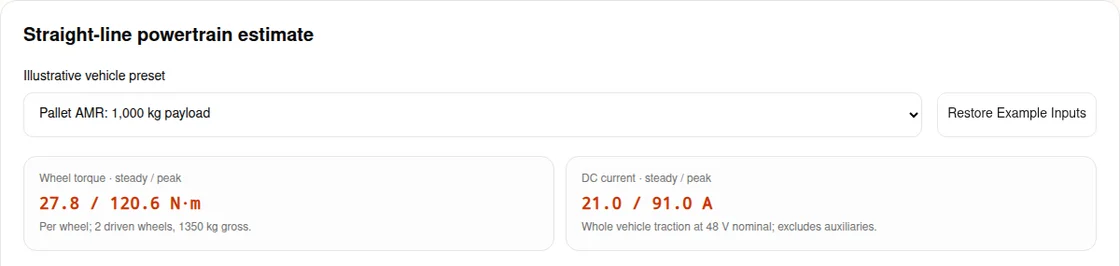
Wheel torque · steady / peak
27.8 / 120.6 N·m
Per wheel; 2 driven wheels, 1350 kg gross.
DC current · steady / peak
21.0 / 91.0 A
Whole vehicle traction at 48 V nominal; excludes auxiliaries.
Concept assumptions, not component ratings. Straight travel, equal wheel load and clean dry floor only. Safety, thermal performance and dynamic load transfer remain unvalidated. See formulas and limitations.
Drive Wheel Count
2 — follows topology.
40–95 %; required.
-25–55 °C; required.
Efficiency and tread coefficients are illustrative constants, not measured supplier properties. Duty and ambient are captured for review; they do not establish a thermal rating.
Wheel speed
143.2 RPM
At 1.5 m/s. Motor RPM needs the selected gear ratio.
Tractive force · steady / peak
556 / 2412 N
Whole vehicle; grade and acceleration assumed simultaneous.
Mechanical power · steady / peak
834 / 3618 W
Whole vehicle at target speed; wheel output, before drivetrain losses.
Static traction ratio
2.32×
Assumed grip / peak demand; no dynamic weight transfer or turning model.
Grade holding allowance
29.8 N·m/wheel
Chosen 1.5× static grade factor; not a motor brake rating or stopping check. Zero grade still needs a parking review.
Illustrative downhill regen
2509 W peak
Assumed 1.2 m/s² stop. Resistor resistance, pulse energy and BMS acceptance require hardware data.
Thermal feasibility, tread lifetime, stopping distance and scanner protective fields are unknown. Obtain the actual torque/time cycle, derating curves, brake response and worst-case floor tests before releasing the design.
Build the validation planDesign guide · reviewed
Published by AMRDriveUnit. First recorded . Method and source review: every six months, or when cited requirements change. Send corrections through the engineering inquiry form.
Use the tool to establish a concept demand, then close the unknowns below. The focus is complete drive system architecture; mounting details and catalog selection have separate guides.
Wheel torque follows force × wheel radius / driven wheels. A motor rating additionally needs reduction ratio, speed, losses and the complete duty trace.
Reproducible method belowAt equal electrical power, doubling voltage halves DC current. With the same wire resistance, cable I²R loss falls to one quarter. Cable mass and inverter efficiency do not follow automatically.
Explicit equal-power comparisonThe example static grip ratio compares assumed floor friction and wheel load with demand. It does not model pitch, suspension or lateral forces; confirm the worst loaded wheel on the real route.
Assumptions and measurement planA regen peak does not select a resistor or prove a stop. Check pulse energy, repetition, BMS acceptance and the drive manufacturer limits, then test loaded stopping performance.
Manufacturer method + validation planConfirm product classification and placement date. The transition to Regulation (EU) 2023/1230 does not make this concept tool a conformity assessment.
Dated legal sourceMechanical drive assembly guide · AGV drive system selection · Custom AGV and AMR drive unit sourcing
This is an idealized longitudinal force balance, not an ISO formula or component certification. Let m be payload plus chassis mass in kg; g = 9.80665 m/s²; θ = atan(grade / 100); a = speed / acceleration time; r = wheel diameter in metres / 2; N = driven wheels.
| Output | Equation | Boundary |
|---|---|---|
| Steady force (N) | Fsteady = m × g × cos(θ) × Crr + m × g × sin(θ) | Constant speed on the selected uphill grade |
| Peak force (N) | Fpeak = Fsteady + 1.10 × m × a | Chosen inertia approximation; constant acceleration and grade together |
| Wheel torque (N·m) | T = F × r / N | Equal wheel sharing; motor shaft torque needs reduction ratio |
| Wheel RPM | speed × 60 / (2 × π × r) | No tire compression or slip correction |
| DC power and current | Pdc = F × speed / η; Idc = Pdc / nominal voltage | η = assumed transmission efficiency × 0.90 motor efficiency; auxiliary loads and voltage sag omitted |
| Static grip ratio | μ × m × g × cos(θ) × driven share / Fpeak | Fixed assumed friction; no CG transfer, cornering or suspension model |
| Grade holding allowance | 1.5 × m × g × sin(θ) × r / N | Chosen wheel-side allowance; brake location and losses unvalidated |
| Illustrative regen peak (W) | max(0, (1.10 × m × 1.2 − Froll + Fgrade) × speed × η) | Example downhill stop; 1.2 m/s² is assumed, not a mandated deceleration |
The traction flags below 1.05× and 1.35× are internal review thresholds. A higher ratio does not establish safe performance. Inputs outside the supported domain withhold both results and export.
Engineering comparison, not measured odometry or payload rankings. The tool covers straight travel on conventional wheels only.
| Architecture | Useful capability | Cost or mismatch to investigate |
|---|---|---|
| Differential, 2 driven wheels | Straight travel and spot rotation | No direct lateral travel; pivot scrub and castor drag excluded |
| Dual swerve, 2 driven wheels | Steered translation in different directions | Steering actuator power, cable routing and calibration excluded |
| Quad swerve, 4 driven wheels | Distributed driven contacts | More controlled axes; uneven loading can defeat equal sharing |
| Steered trike, 1 driven wheel | Simple steering architecture | Turning envelope and available driven load constrain the mission |
| Mecanum, 4 driven wheels | Lateral travel without steering axes | Roller vector forces need a different model; calculator output is withheld |
Kinematic comparison and declared model boundary; no universal payload band is asserted.
Tool efficiencies are illustrative inputs for comparison, not guaranteed performance of a gearbox family.
| Concept option | Efficiency assumed here | Evidence required before selection |
|---|---|---|
| Planetary | 0.92 | Ratio, torque-speed map, backlash, bearing load and mounting drawing |
| Cycloidal | 0.86 | Load-dependent efficiency, starting drag, shock limits and lubrication |
| Hypoid | 0.89 | Drive/backdrive losses, mounting orientation and thermal dissipation |
| Direct drive path | 0.96 path × 0.90 motor | No reduction advantage; verify continuous torque and hub thermal path |
AMRDriveUnit concept assumptions. Missing supplier test curves remain unknown; no shock rating or packaging dimension is inferred.
Worked comparison at 2,400 W electrical traction demand; current = power / voltage. Actual demand varies with efficiency and battery voltage.
| Nominal bus | Ideal current at 2,400 W | Cable loss for the same R, relative to 24 V |
|---|---|---|
| 24 V | 100 A | 1.00× |
| 48 V | 50 A | 0.25× |
| 96 V | 25 A | 0.0625× |
Algebraic comparison, not a cable-sizing table. Select wiring, protection and voltage ratings from actual limits; nominal voltage alone does not establish electrical safety.
The model uses fixed illustrative (Crr, friction μ) pairs: NDI PU (0.012, 0.65), standard PU (0.018, 0.55), ESD PU (0.016, 0.58), soft PU (0.024, 0.72). These are not certified material properties.
| Operating condition | Why the estimate may fail | Minimum next step |
|---|---|---|
| Clean, dry, straight indoor route | Actual wheel and floor may differ from the example | Measure drawbar drag and grip at representative loads |
| Wet, dusty, oily or worn floor | Assumed dry friction is inapplicable | Measure a lower-bound coefficient; derate acceleration and grade |
| Uneven floor or changing payload | Static driven load share misses wheel unloading | Measure individual contact loads through the route |
| Freezer, outdoor or towed trailers | Cold drag, environment and trailer forces are excluded | Use a route-specific model and supplier qualification |
Model limitations and proposed measurements. A ratio above 1 does not verify safe traction.
The calculator captures duty and ambient conditions for handoff. It has no winding temperature, RMS load spectrum or fatigue-life model.
| Unknown | Decision risk | Validation evidence |
|---|---|---|
| Motor and inverter continuous rating | A short acceleration peak may dominate repeated-cycle heating | Torque/speed/time trace, loss maps and stabilized temperature test |
| Tread compound and hub | Load, speed and temperature affect deformation and bonding | Wheel supplier load/speed/temperature data; endurance test |
| Wheel bearing and axle | Cantilever moment and floor shocks may dominate | Individual bearing loads, geometry and supplier fatigue calculation |
| Housing-to-chassis thermal path | A sealed housing may reject insufficient heat | Mounting contact, interface resistance and worst-ambient validation |
Engineering validation checklist. No generic tread blowout temperature, heat-sink thickness or bearing lifetime is claimed.
The selected brake plan records intent. It does not establish brake capacity or a safety performance level.
| Function or estimate | What it can tell you | What remains open |
|---|---|---|
| Static grade holding allowance | Wheel-side torque using a chosen 1.5× gravity allowance | Actual factor, gearbox backdrive, brake location, wear and parking test |
| Motor controlled deceleration | Can return energy into the DC link | Available torque under faults, traction, BMS and power loss |
| STO / safety-related controls | Control safety must be assessed as a system | Stopping sequence, required PL, hardware diagnostics and validation |
| Scanner protective field | Requires a validated stop and response chain | Worst-case measured stopping distance, sensor tolerances and field configuration |
ISO public scope supports a design methodology, not universal PL ratings or response times. Use the relevant truck standard and actual device manuals.
Source and scope limitationsTool output assumes downhill deceleration at 1.2 m/s² and uses the same illustrative drivetrain efficiency in reverse. It is not a prescribed emergency deceleration.
| Required input | Why it matters | Alternative or mitigation |
|---|---|---|
| Battery charge acceptance versus state and temperature | The BMS may limit or interrupt returned energy | Validate absorption at full charge and low temperature |
| Drive clamp voltage and permitted resistor range | An arbitrary resistance can overload the chopper | Follow the selected drive manual; no resistor ohms are recommended here |
| Stop time, energy and repetition | Peak watts alone do not establish pulse or average rating | Integrate braking power over time and verify cooling/duty limits |
| Failure and mechanical stopping behavior | A resistor does not establish power-loss stopping | Validate the whole braking architecture on the vehicle |
Beckhoff demonstrates the distinction between peak and continuous braking power for a specific axis. Obtain the AMR drive manufacturer data for an actual selection.
Source and scope limitationsProcurement comparison based on engineering judgment. Price, NRE, MOQ, lead time and savings are quote-dependent and currently unknown.
| Decision dimension | Catalog route | Custom route |
|---|---|---|
| Early proof of concept | Useful when an existing envelope and ratings fit | Useful when catalog constraints block the architecture |
| Mechanical fit | Check adapters, suspension and service access | Specify interfaces, load paths and tolerances before releasing CAD |
| Engineering cost and schedule | Confirm stock, integration work and test availability | Obtain scoped NRE, prototype milestones and validation responsibilities |
| Production and service | Check supply continuity and replacement interchangeability | Agree tooling ownership, revision control and lifecycle spares |
Decision framework only; no universal BOM saving, mass reduction or delivery promise.
Reviewed 2026-10-25. Confirm the actual product classification and placement date with the responsible supplier and integrator. The tool makes no claim that a selected drive is compliant or that a document has already been issued.
| Framework | Where PCM classification applies | What to confirm |
|---|---|---|
| Directive 2006/42/EC, before the general transition | Article 13; declaration of incorporation in Annex II 1.B; assembly instructions in Annex VI | Applicability to the supplied assembly and final machine integration responsibilities |
| Regulation (EU) 2023/1230, generally from 20 January 2027 | Article 11; EU declaration of incorporation in Annex V Part B; assembly instructions in Annex XI | Transition provisions, scope, documentation and product placement date |
The incorporation route does not demonstrate conformity of the completed robot. Marking obligations under other applicable legislation must be assessed separately; a blanket “no CE” statement is inappropriate.
Illustrative calculations, not customer deployments or measured outcomes. Each uses the same formulas and declared coefficients as the tool. Changing duty or ambient does not create a validated thermal prediction.
Inputs: 1000 + 350 kg; 1.5 m/s in 1.2 s; 3% grade; 200 mm wheels; 2 driven wheels; 48 V.
Assumptions: planetary; ndi-vulkollan; 65% static driven load share. All other constants follow the method above.
Use the simultaneous grade/acceleration result as a concept demand. Ask for motor torque-speed curves and verify worst-case traction before picking a ratio.
Inputs: 220 + 80 kg; 1.8 m/s in 0.8 s; 2% grade; 160 mm wheels; 2 driven wheels; 24 V.
Assumptions: planetary; standard-pu; 70% static driven load share. All other constants follow the method above.
Keeping this same demand and efficiency, changing to 48 V halves estimated bus current. Confirm battery/controller ratings rather than inferring a wire gauge.
Inputs: 2500 + 500 kg; 1 m/s in 1.5 s; 6% grade; 250 mm wheels; 4 driven wheels; 96 V.
Assumptions: cycloidal; high-traction-pu; 85% static driven load share. All other constants follow the method above.
Equal load sharing reduces per-wheel demand in this calculation. Measure the least-loaded wheel and add steering demand before accepting a four-module design.
Use acceptance criteria agreed for the actual mission and applicable requirements. The following checks define evidence to request, not a ready-made safety approval.
| Decision | Evidence to collect | Mitigation or alternate path |
|---|---|---|
| Torque and control sizing | Torque-speed map, current logs and actual acceleration at loaded voltage | Increase ratio, relax acceleration or select a larger drive |
| Traction and stopping | Worst-case load, floor, grade, brake delay and full stopping tests | Reduce speed/grade demand, change load sharing or brake architecture |
| Thermal endurance | Representative repeated duty at worst ambient until temperatures stabilize | Derate the cycle, improve heat rejection or select a larger continuous rating |
| Regen and power failure | DC-link voltage, BMS behavior, pulse energy and loss-of-power behavior | Validate an energy sink and mechanical stopping/holding strategy |
| Commercial release | Quote, NRE, supplier drawings, documented scope and agreed test ownership | Use a catalog prototype if customization has not earned its schedule/cost |
Wheel output torque per driven wheel. Motor shaft torque additionally needs the chosen gear ratio and gearbox efficiency; motor speed and the torque-speed envelope must also be checked.
Torque to maintain target speed on the selected grade with the example rolling resistance. It is a mission demand, not a verified continuous motor rating.
No. Roller vector forces and direction-dependent losses need a separate model. Selecting Mecanum withholds estimates and export; send the mission and motion directions for engineering review.
For fixed required force, wheel torque grows with radius. At fixed vehicle speed, wheel RPM falls as diameter grows. Ground clearance, floor joints and the actual tire rolling resistance require separate checks.
No. They are explicitly labeled concept assumptions for comparing sensitivity. Replace them with supplier curves and measurements before component selection; no material temperature limit or backlash rating is implied.
No. It only means assumed static grip exceeds the modeled straight-line demand. Dynamic wheel unloading, turns, contamination and local contact differences can invalidate it.
No. At the same power it halves bus current, and at the same wire resistance cable loss is one quarter. Battery, controller and motor compatibility, voltage excursions, cost and efficiency still need comparison.
No. The tool divides whole-vehicle electrical traction power by nominal bus voltage. Phase current depends on torque, motor constants and inverter operation; the tool cannot choose a phase-current limit.
No. It records the intended moving/rest fraction for review. Supply the torque and speed trace, cooling path, losses and temperature limits to validate repeated acceleration and continuous operation.
No. The selected drive clamp voltage, minimum resistance, current limit, pulse energy, repetition and cooling must be known. Battery absorption and failure behavior are also part of the architecture.
No. It is a chosen concept allowance on static grade torque at the wheel. The final factor and brake rating must follow the application assessment, applicable requirements and supplier data.
No. Field length requires measured worst-case stopping, the full response-time chain and device-specific margins. This page provides neither a certified stopping distance nor a scanner configuration.
Do not infer classification from a product name or this calculator. Confirm the intended function, supplied assembly and applicable legislation with the responsible supplier and integrator.
Its general application date is 20 January 2027, with some provisions applying earlier. Check the placement date, transition provisions and actual product scope. Do not treat a reference to the future framework as a current certification.
Add CAD envelope, actual wheel loads, floor and grade measurements, torque/speed/time duty trace, voltage range, control interface, quantity and validation requirements. Thermal and safety unknowns remain listed in the brief.
Restore example inputs or correct the highlighted fields. For unavailable Mecanum sizing, send your mission profile for review. You can manually select the valid brief, email it, or use the contact RFQ form; without JavaScript the default example and guide remain readable.
Reviewed 2026-10-25. Public standard summaries support their scope only; they are not evidence of clause-specific thresholds or certification of this tool. Numerical coefficients and scenarios are labeled engineering assumptions. No customer field-test evidence is claimed.
Public scope: driverless industrial truck safety and verification. The catalog entry does not substantiate the previous fixed braking, scanner margin or muting numbers. Full requirements must be checked for the application.
Open primary sourcePublic scope: design and integration methodology for safety-related controls. It does not prescribe a universal required performance level for every application.
Open primary sourceFor the pre-transition machinery framework, check Article 13, Annex II 1.B and Annex VI when the supplied assembly is partly completed machinery. Confirm scope and placement date for the actual product.
Open primary sourceGeneral application from 20 January 2027; some provisions apply earlier. For a product classified as partly completed machinery, consult Article 11, Annex V Part B and Annex XI. A calculator cannot determine classification or demonstrate conformity.
Open primary sourceManufacturer example showing that regenerative peak and continuous power both matter. It is an axis-specific example, not a resistor selection rule for every AMR or an endorsement of this tool.
Open primary sourceCopy the concept brief above and paste it into Project Summary on the RFQ form. Add your CAD envelope, duty trace, actual floor conditions and quantity. Ask the engineering team to confirm feasibility, documentation and delivery scope.