
Custom powertrains: architecture decision report
Industrial AMR / AGV scope · Planning estimates, not rated component selection
Published by AMRDriveUnit · Page created · Reviewed . Public deployment date is not independently verified.
Use the tool to prepare a battery-to-wheel power budget. Use this report to identify which measurements and supplier data are still needed before choosing hardware. An energy budget alone cannot establish traction, thermal capacity or safety performance.
| Decision | Useful output | Before releasing a design |
|---|---|---|
| DC supply | Peak current at nominal voltage | Check low-SoC voltage sag, pulse current and charged voltage. |
| Regeneration | Downhill stopping power and zero-acceptance case | Obtain BMS permission map and drive/resistor energy ratings. |
| Runtime | Flat-travel and powered-idle estimate | Measure acceleration, ramp, steering and lift energy. |
| Safety | Illustrative service-stop distance only | Measure worst-case stops and validate the safety function and field. |
Evidence: Victron Energy — BMS charge permission · ABB ACS880-31 hardware manual — Resistor braking · ISO 3691-4:2023 — Driverless industrial trucks
1. Calculation method and known limits
Reproducible equations; efficiency inputs are illustrative assumptions.
| Quantity | Method | Limitation |
|---|---|---|
| Ramp traction (N) | m·g·(Cr·cos θ + sin θ) + m·v/t_acc; θ = atan(grade/100) | Straight travel; rotational inertia, aerodynamic drag and slip excluded. |
| Wheel torque (Nm/wheel) | F·r / driven wheel count | Equal load sharing; verify axle and corner loads. |
| Motor shaft torque (Nm) | Wheel torque / (ratio·gear efficiency) | Screening ratio; torque-speed capability unverified. |
| DC input power (W) | F·v / (ηgear·ηmotor·ηinverter) + auxiliaries | Constant stage efficiencies; inaccurate near stall and at partial load. |
| RMS torque (Nm) | √[duty·(0.2·Tacc² + 0.6·Tflat² + 0.2·Tbrake²)] | Synthetic travel profile, not the measured duty cycle or a motor rating. |
| Downhill braking (N) | max(0, m·v/t_dec + m·g·sin θ − Cr·m·g·cos θ) | Assumes requested deceleration is achievable. |
Inverter efficiency is fixed at 96.5%. Motor assumptions are 91% for the BLDC label, 94% for PMSM and 85% for induction. Gear efficiency and ratio follow the selected architecture. These are model inputs, not measurements or catalog guarantees. Peak power assumes acceleration and maximum uphill grade occur together at top speed.
The normal-load ledger is total vehicle weight. Available grip depends on the load on driven wheels and measured floor friction. The tool cannot validate slip, mecanum losses, turning scrub, stall heating or tire deformation from these inputs.
2. DC bus voltage, current and protection
For an assumed 2400 W electrical input, I = P/V. Doubling voltage halves current; at unchanged resistance, cable loss falls to one quarter. This does not mean total system efficiency quadruples. A nominal 48 V label does not establish safe accessible voltage under charge or transients.
| Nominal bus | Current at 2400 W | Loss at assumed 0.02 Ω loop |
|---|---|---|
| 24 V | 100.0 A | 200.0 W |
| 48 V | 50.0 A | 50.0 W |
| 80 V | 30.0 A | 18.0 W |
| 96 V | 25.0 A | 12.5 W |
Obtain pack minimum/maximum voltage, short-circuit current, BMS disconnect behavior and charger settings. Coordinate protection with cable ampacity and inverter limits. Fuse rating, contactor poles, insulation and bonding are system-specific decisions.
3. DC-link precharge and capacitor reliability
TI describes precharge as a way to reduce capacitive inrush and contactor damage. For an ideal RC circuit, Vcap = Vbat·(1 − exp(−t/RC)). With assumed 48 V, 4700 µF and 25 Ω, initial current is 1.92 A, the time constant is 117.5 ms and reaching 85% takes about 223 ms. This is an arithmetic example; the circuit topology, closure threshold and fault response require hardware validation.
| Check | Required data | Failure to prevent |
|---|---|---|
| Precharge resistor | Maximum voltage, total capacitance, repetition and pulse energy | Overheated resistor or welded contactor |
| Voltage supervision | Sensor tolerances, threshold, timeout and diagnostic coverage | Closing into an uncharged or faulted link |
| Discharge path | Stored energy, required access voltage and measured discharge time | Residual capacitor energy during service |
| Capacitor ripple | PWM waveform, ESR/frequency, temperature and supplier lifetime curve | Unverified capacitor heating and service life |
No universal 85% closure, 500 ms timeout, capacitor type or bleeder resistance is asserted under EN 1175. A generic standard reference cannot replace the selected drive installation instructions.
4. Motor control and torque-speed matching
BLDC and PMSM labels overlap in permanent-magnet machines. Compare the selected motor winding, back-EMF, feedback and controller behavior. Shaft torque does not determine phase current without a torque constant and a consistent RMS/peak convention. The tool therefore leaves phase current unknown.
TI documents MTPA for IPM motors and field weakening with negative d-axis current above base speed. These methods have current and thermal constraints; they do not guarantee a fixed speed increase or copper-loss reduction on an unspecified motor.
5. Reduction stages, packaging and hub bearing loads
| Layout | Ratio / gear efficiency | Validation focus |
|---|---|---|
| Integrated BLDC + Precision Planetary Hub | 16:1 / 93% | Moderate radial shock rating compared to cycloidal; requires precision mounting face. |
| Integrated PMSM + Cycloidal Pin-Gear Hub | 21:1 / 88% | Slightly lower mechanical stage efficiency (88%), higher initial manufacturing cost. |
| Coaxial Dual-Axis Steer-Traction Powertrain | 20:1 / 90% | Higher mechanical complexity, two servo drive channels required per drive corner. |
| 4WD All-Wheel Independent Drive Powertrain | 25:1 / 91% | Requires 4-axis synchronized fieldbus coordination (EtherCAT / CANopen). |
| Direct-Drive High-Torque Outer-Rotor PMSM | 1:1 / 100% | Requires high phase current at stall; limited continuous low-speed hill climbing torque. |
Compare continuous and emergency torque, output bearing moment capacity, backlash, lubrication and service access. Cycloidal gearing does not inherently guarantee a five-times shock rating. Four driven wheels do not remove wheel-slip risk or establish fault-tolerant operation.
For a wheel load Fr at axial offset x, bending moment is Fr·x before lateral forces are added. Example: 2500 N at 0.05 m creates 125 Nm. Bearing spacing, preload, stiffness, load spectrum and contamination determine the actual bearing arrangement and life; this screen cannot guarantee service hours.
6. Regenerative braking and the zero-acceptance case
The tool adds downhill gravity to deceleration demand, subtracts rolling resistance, then applies the reverse-path efficiency. The entered charge rate represents assumed permitted absorption: nominal V × Ah × C. It is not inferred from chemistry. Set it to zero to examine a full or charge-disabled pack. Even a zero excess result under the assumption cannot establish that a resistor is unnecessary.
| Case | Tool coverage | Required next step |
|---|---|---|
| Stop with charge-permitted pack | Peak downhill-stop power minus assumed acceptance | Confirm instantaneous BMS permission and maximum bus voltage. |
| Full, cold or disconnected pack | Zero-acceptance regeneration power shown separately | Verify complete energy sink and fault response. |
| Repeated stops | Repetition and pulse energy not modeled | Integrate stop energy and use resistor thermal curves. |
| Continuous descent | Not a route simulation | Check sustained regeneration and continuous resistor power. |
A candidate resistance must satisfy both drive minimum resistance and sufficient braking power at the actual chopper threshold. Pulse energy, chopper current, repetition, overtemperature protection and mounting clearances also constrain selection. No resistance value is recommended by this tool.
Evidence: ABB ACS880-31 hardware manual — Resistor braking · Victron Energy — BMS charge permission
7. Parking, power loss and holding brakes
STO removes torque-producing drive energy. It can lead to coast-down and cannot hold a vehicle on a slope. Validate the required stopping and parking arrangement for loss of power, brake wear, maximum grade and payload. Confirm whether a proposed holding brake is rated for dynamic emergency stops; a static holding rating alone is insufficient.
Evidence: Schneider Electric — Safe Torque Off function · IEC 61800-5-2:2016 — Drive functional safety
8. Battery autonomy and mission energy
Usable-energy assumptions are LFP 85%, NMC 80% and LTO 92%. These fractions are scenario placeholders, not chemistry guarantees. Average power is flat-cruise electrical power × travel fraction + auxiliaries × idle fraction. Runtime is usable Wh divided by average W.
| Term | Coverage | Practical correction |
|---|---|---|
| Flat travel / powered idle | Included; no charging during the modeled shift | Check actual Cr and auxiliary watts. |
| Acceleration, ramps and turning | Excluded from runtime | Measure route energy; include ramp duration. |
| Steering, lift and heaters | Only if entered in average auxiliary load | Add their duty-weighted electrical energy. |
| Ageing, cold capacity, reserve and opportunity charge | Not simulated | Use pack data, end-of-life capacity and a charging schedule. |
Charge permission is separate from available discharge energy. A BMS may inhibit charging due to voltage or temperature. Cell-specific data must govern a cold-store design; no universal LTO cold-charge capability or cycle-life claim is made here.
Evidence: Victron Energy — BMS charge permission
9. Thermal losses and continuous torque
The displayed heat loss is flat-cruise traction input minus wheel output, excluding auxiliaries. It is not a temperature prediction. Uphill demand is listed separately; low-speed high-torque and stall loss require motor copper and iron loss data. A cooling selection records the intended concept and never produces a thermal pass.
| Concept | Benefit to investigate | Constraint to verify |
|---|---|---|
| Natural convection | No fan power or moving fan parts | Enclosure air temperature and available surface area |
| Chassis conduction | Conductive path into the frame | Contact area, interface resistance and frame temperature |
| Forced air | Controlled heat transfer if airflow is available | Dust, fan failure, acoustic limits and actual airflow |
An illustrative RMS torque does not guarantee thermal safety. Use the actual route torque-time history, winding resistance, thermal impedance, magnet limits and drive current derating. A fitted multi-node thermal model needs measured or supplier-derived parameters; no generic overload duration or winding temperature is supplied.
10. Stopping and functional-safety validation
The service-stop illustration uses distance = v × 0.12 s + v × t_dec / 2. The 120 ms latency is a tool assumption. No added percentage or distance allowance is claimed to come from ISO 3691-4. Requested deceleration is not a measured stopping capability; load transfer, grip, brake condition, floor and grade must be validated.
ISO 3691-4:2023 addresses driverless industrial truck safety and verification. IEC 61800-5-2 addresses safety-related drives. Required performance and the applicable edition depend on the system assessment. A certified component does not establish vehicle compliance, and this page does not configure a scanner protective field.
Evidence: ISO 3691-4:2023 — Driverless industrial trucks · IEC 61800-5-2:2016 — Drive functional safety · Schneider Electric — Safe Torque Off function
11. Worked screening examples
Five illustrative scenarios generated from the same calculator as the tool; not measured customer cases.
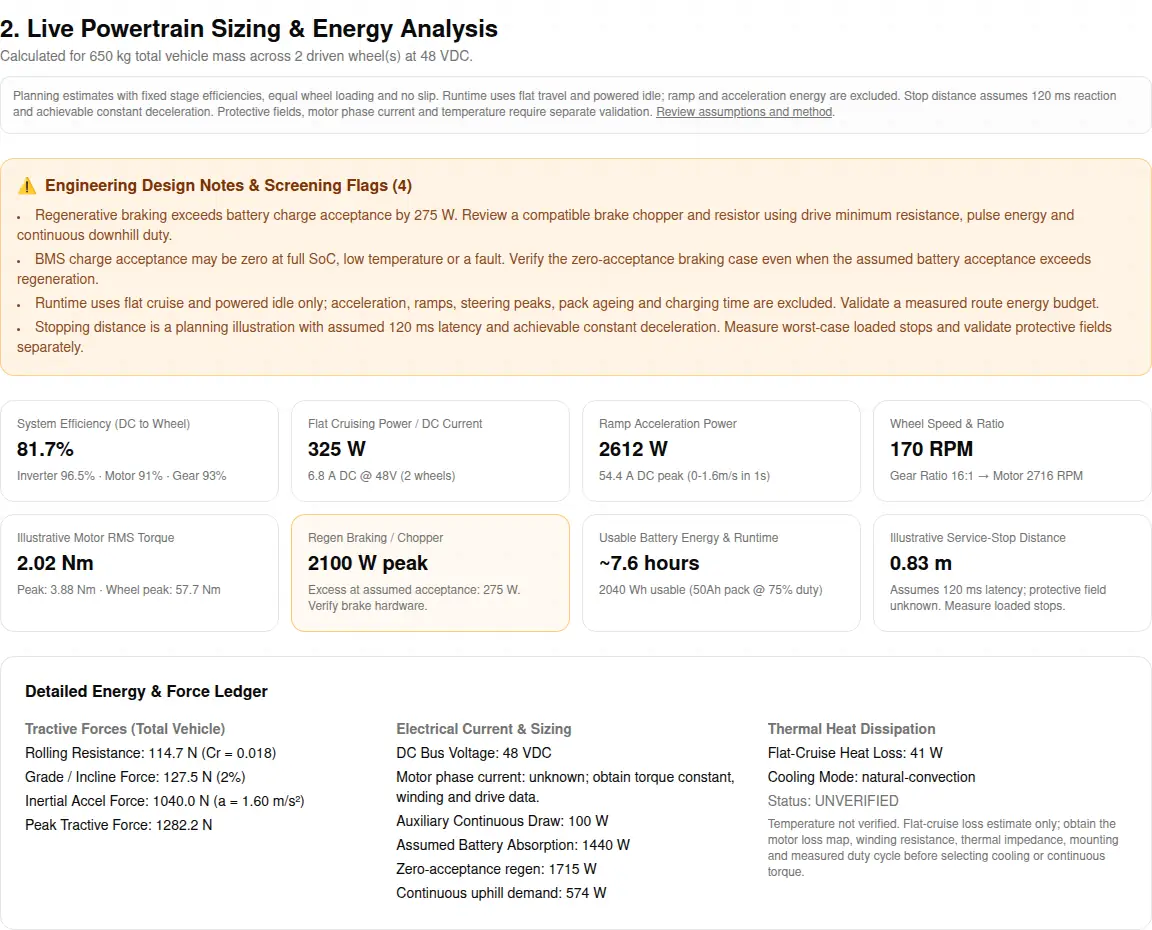
Standard Logistics AMR (500 kg Payload)
Inputs: 650 kg total, 1.6 m/s, 2% grade, 1 s acceleration / 0.8 s deceleration, Cr 0.018, 180 mm wheels × 2. 48 V, 50 Ah, 0.6C assumed charge permission, 75% travel, 100 W auxiliaries. Integrated BLDC + Precision Planetary Hub; Brushless DC (Sinusoidal BLDC); lifepo4.
| Flat cruise / uphill | Ramp acceleration | Flat-route runtime | Zero-acceptance regen |
|---|---|---|---|
| 325 / 574 W | 2612 W / 54.4 A | 7.6 h | 1715 W peak |
Next step: Measure acceleration and stopping duty before selecting motor and brake hardware. Temperature and protective-field size remain unverified.
Choose this preset in the tool selector ↑Heavy-Duty Pallet AMR (1,500 kg Payload)
Inputs: 1850 kg total, 1.2 m/s, 6% grade, 1.5 s acceleration / 1.2 s deceleration, Cr 0.018, 250 mm wheels × 2. 48 V, 100 Ah, 0.8C assumed charge permission, 70% travel, 180 W auxiliaries. Integrated PMSM + Cycloidal Pin-Gear Hub; Permanent Magnet Synchronous (PMSM + FOC); lifepo4.
| Flat cruise / uphill | Ramp acceleration | Flat-route runtime | Zero-acceptance regen |
|---|---|---|---|
| 671 / 2303 W | 4528 W / 94.3 A | 7.8 h | 2501 W peak |
Next step: Measure ramp duration and continuous heat load; flat-route runtime omits this energy. Temperature and protective-field size remain unverified.
Choose this preset in the tool selector ↑High-Speed Cross-Belt / Sorter (150 kg Payload)
Inputs: 250 kg total, 2.5 m/s, 0.5% grade, 0.8 s acceleration / 0.6 s deceleration, Cr 0.018, 160 mm wheels × 2. 48 V, 40 Ah, 1C assumed charge permission, 85% travel, 120 W auxiliaries. Integrated BLDC + Precision Planetary Hub; Permanent Magnet Synchronous (PMSM + FOC); lifepo4.
| Flat cruise / uphill | Ramp acceleration | Flat-route runtime | Zero-acceptance regen |
|---|---|---|---|
| 251 / 287 W | 2602 W / 54.2 A | 7.1 h | 2130 W peak |
Next step: Measure acceleration and stopping duty before selecting motor and brake hardware. Temperature and protective-field size remain unverified.
Choose this preset in the tool selector ↑All-Terrain Outdoor Heavy Transporter (3,000 kg Payload)
Inputs: 3800 kg total, 1 m/s, 8% grade, 2 s acceleration / 1.5 s deceleration, Cr 0.018, 300 mm wheels × 4. 80 V, 150 Ah, 0.5C assumed charge permission, 60% travel, 250 W auxiliaries. 4WD All-Wheel Independent Drive Powertrain; Permanent Magnet Synchronous (PMSM + FOC); lifepo4.
| Flat cruise / uphill | Ramp acceleration | Flat-route runtime | Zero-acceptance regen |
|---|---|---|---|
| 1063 / 4660 W | 6962 W / 87.0 A | 13.8 h | 3992 W peak |
Next step: Measure ramp duration and continuous heat load; flat-route runtime omits this energy. Temperature and protective-field size remain unverified.
Choose this preset in the tool selector ↑Coaxial Steer-Traction AGV (800 kg Payload)
Inputs: 1020 kg total, 1.4 m/s, 2.5% grade, 1.1 s acceleration / 0.9 s deceleration, Cr 0.018, 200 mm wheels × 2. 48 V, 70 Ah, 0.7C assumed charge permission, 70% travel, 160 W auxiliaries. Coaxial Dual-Axis Steer-Traction Powertrain; Permanent Magnet Synchronous (PMSM + FOC); lifepo4.
| Flat cruise / uphill | Ramp acceleration | Flat-route runtime | Zero-acceptance regen |
|---|---|---|---|
| 469 / 897 W | 3124 W / 65.1 A | 7.6 h | 1893 W peak |
Next step: Measure acceleration and stopping duty before selecting motor and brake hardware. Temperature and protective-field size remain unverified.
Choose this preset in the tool selector ↑12. Make, buy or customize: integration risks
| Approach | Potential advantage | Cost / integration risk | Mitigation |
|---|---|---|---|
| Separate motor, reducer and drive | Choice of suppliers and service parts | Alignment, interfaces and divided warranty responsibility | Assign an integration owner and test the assembly. |
| Integrated catalog module | Defined packaging and interfaces | Fit, ratio or cooling may not suit the mission | Validate envelope, load curves and replaceability. |
| Custom module | Tailored mechanical and electrical interfaces | Tooling, NRE, revision control and prototype time | Agree drawings, acceptance tests, volume and spare-parts plan. |
These are engineering tradeoffs, not quoted prices or guaranteed delivery. Avoid using flat-floor runtime for a ramp mission, treating peak torque as continuous torque, or assuming component safety certificates cover the complete vehicle.
For related work: single drive-unit sizing, vehicle drivetrain layouts, drive-system integration, and manufacturing and DFM.
13. Frequently asked decision questions
Powertrain Sizing & Physics
What does this custom powertrains tool cover?
It screens battery-to-wheel energy demand for industrial AMRs and AGVs. It adds DC current, conditional regeneration and flat-route runtime to wheel and motor force estimates. Automotive engine and transmission tuning is outside its scope.
Are the efficiency percentages measured product ratings?
No. They are fixed illustrative assumptions: inverter 96.5%, motor 85–94% by selection, and gear stage 88–100%. Multiply them for DC-to-wheel efficiency and replace them with supplier loss maps before component selection.
Can illustrative RMS torque select the final motor?
No. The tool uses a duty-weighted travel profile of 20% ramp acceleration, 60% flat cruise and 20% downhill braking. Actual ramp duration, stall, lift and steering loads, thermal constants and overload limits must be checked from route logs.
How should I choose rolling resistance?
Measure pull force on the actual tire and floor at representative load, then divide by normal load. The default 0.018 is an assumption. Seams, soft tires, contaminants and tire deflection may invalidate it; rolling resistance is distinct from grip friction.
Do MTPA and field weakening guarantee more vehicle speed?
TI documents MTPA for IPM current optimization and negative d-axis current for field weakening. Neither guarantees a percentage gain. Verify winding voltage, current, torque-speed envelope, demagnetization margin and tire speed rating. See the TI FOC source.
Battery & DC Bus
How does moving from 24V to 48V change current and cable loss?
At the same 2400 W input, current falls from 100 A to 50 A. For unchanged cable resistance, I²R loss falls to one quarter. System efficiency does not quadruple. Cable ampacity, voltage drop and charged pack voltage still require separate checks.
How do I screen battery discharge C-rate?
Divide peak DC current by pack capacity in Ah. A 120 A peak from 60 Ah is 2C. Check the pack supplier pulse duration, cell temperature, BMS current limits and voltage sag at low state of charge; chemistry alone does not establish a rating.
Can the tool compare LFP, NMC and LTO lifetime?
No. Chemistry selection changes only an illustrative usable energy fraction (LFP 85%, NMC 80%, LTO 92%). Obtain cell-specific cycle-life, temperature and charge data. No chemistry is immune to faults or guarantees cold charging.
Why do auxiliary loads remain in the runtime estimate at idle?
The model assumes sensors, computing and control remain powered during idle. A 120 W auxiliary load consumes 960 Wh in eight hours. Charging time is excluded. Include steering and lifting average power in the auxiliary budget if applicable.
How should DC-link precharge be designed?
Use the selected inverter capacitance, pack maximum voltage and contactor limits. For an ideal resistor-capacitor model, Vcap = Vbat(1 − exp(−t/RC)). TI explains the principle; closure threshold, timeout and discharge circuit require hardware-specific verification, not a universal standard clause.
Regeneration & Braking
Why can the DC bus trip even when the battery is large?
A full pack, charge-inhibited BMS or disconnected battery may accept no regenerative current. The Victron BMS manual provides an example of voltage and temperature inhibits. Verify a zero-acceptance stop and sustained downhill braking for the actual vehicle.
Why does the tool avoid recommending a resistor resistance?
A resistance calculated only from power can violate the drive minimum resistance and overload the chopper. ABB requires compatible resistance, braking power and energy capacity. Use the actual switching threshold, current limit, pulse energy and duty cycle before choosing hardware.
What is missing from a DC-link capacitor lifetime estimate?
PWM frequency, modulation, phase-current waveform, ESR versus temperature and frequency, cooling and manufacturer lifetime curves are needed. This tool does not calculate ripple stress or capacitor life. Obtain a drive-qualified capacitor design rather than applying a universal phase-current multiplier.
Can regeneration or STO hold a robot on a ramp?
STO removes torque-producing energy and can cause coast-down, as described by Schneider Electric. Parking and power-loss holding need a validated brake arrangement. A holding brake must also have the required dynamic-stop rating if it will stop a moving load.
Thermal & Mechanical Validation
How do wheel offsets change hub bearing loads?
An offset radial load adds bending moment M = Fr × offset; lateral wheel force adds another moment. Bearing arrangement, preload, spacing, shock spectrum and supplier load ratings determine suitability. No bearing type or lifetime is guaranteed from payload alone.
Does a low loss estimate prove the motor stays cool?
No. Loss watts require a thermal path and temperature limits. The tool reports flat-cruise conversion losses only and leaves temperature unverified. Obtain winding resistance, loss maps, transient thermal impedance, mounting conditions and measured worst-case route temperatures.
Does chassis conduction always beat forced air?
Cooling depends on contact area, interface resistance, frame temperature, airflow and enclosure conditions. Selecting a cooling concept records the RFQ preference; it does not validate temperature or continuous torque. Compare measurements on the actual mounting assembly.
Safety & Validation
Can I use the stopping result to configure a safety scanner?
No. It is v × 0.12 s + v × deceleration time / 2, with assumed constant achievable deceleration and fixed latency. It is not an ISO protective-field calculation. Use validated worst-case stopping measurements, scanner instructions and the applicable vehicle safety assessment.
Is SIL 3 or PL e universally required for every drive?
Required safety performance depends on the function, applicable standards and system risk assessment. IEC 61800-5-2 covers drive safety-related functions; a component certificate does not establish vehicle compliance. STO alone neither brakes nor proves standstill.
Does a nominal 48V battery establish electrical safety?
No. Check fully charged pack voltage, transients, isolation, short-circuit energy and environmental conditions. Electrical safety and protection must be assessed for the actual system. This page does not assert universal contactor or capacitor requirements under EN 1175.
Custom Engineering & RFQ
How should I compare BLDC and PMSM drives?
The terms overlap in permanent-magnet machines. Compare actual back-EMF waveform, current control, feedback, torque ripple and efficiency maps instead of labels alone. Sinusoidal commutation and FOC capability depend on the chosen motor and controller pairing.
Does a cycloidal reducer always survive higher shock loads?
No. Compare supplier continuous, peak and emergency torque, output bearing moment capacity, backlash, efficiency and service conditions. This tool uses fixed screening gear ratios and efficiencies; it does not certify shock overload or select a rated gearbox.
What must I add to the exported RFQ brief?
Add load distribution, route and slope duration, temperature logs, minimum and fully charged battery voltages, BMS charge permissions, brake requirements, motor and drive limits, fieldbus, envelope drawings and annual volume. The generated brief contains preliminary assumptions, not approved specifications.
How long will a custom powertrain prototype take?
A delivery date requires supplier confirmation of component availability, drawing release, tooling, testing and order quantity. Submit the preliminary brief and envelope drawings for a project-specific schedule; this page does not promise a fixed prototype lead time.
14. Evidence ledger and engineering hand-off
Sources checked 2026-11-06; original page 2026-11-06.
Public standard abstracts establish scope, not unverified clause details. Manufacturer manuals support the specific principles stated above; their product ratings are not AMRDriveUnit ratings. Equations, fixed efficiencies and worked scenarios are disclosed model assumptions. Where public evidence does not establish a value, it remains unknown.
AMRDriveUnit maintains this method and reviews it every six months, or sooner when calculation assumptions, supplier documentation or applicable standards change. Hardware release still requires a project-specific engineering review.
- ISO 3691-4:2023 — Driverless industrial trucks
Public abstract confirms scope and verification requirements for driverless trucks. It does not substantiate a universal stopping-field formula; full text and application assessment are needed.
- IEC 61800-5-2:2016 — Drive functional safety
Official scope for safety-related drive systems. The catalogue also links AMD1:2026; select the applicable edition during compliance review. No universal SIL/PL is inferred here.
- Texas Instruments SLVAFB0 — Pre-charge circuits
Manufacturer explanation of inrush damage and precharge switching. Its high-voltage example is a design principle, not an EN 1175 clause or an AMR component prescription.
- ABB ACS880-31 hardware manual — Resistor braking
Selection method checks braking power, drive minimum resistance and resistor energy capacity. AC-drive ratings in this manual do not specify low-voltage AMR parts.
- Schneider Electric — Safe Torque Off function
STO removes torque-producing energy and can lead to coast-down. It does not itself provide a controlled stop or stationary holding.
- Victron Energy — BMS charge permission
This product manual documents temperature and high-cell-voltage charge inhibits. It illustrates why assumed battery acceptance is conditional, not a limit for every chemistry.
- Texas Instruments — MTPA and field weakening
Explains negative d-axis field weakening and IPM MTPA. Actual speed, current and thermal improvement require the selected motor parameters; no percentage gain is assumed.
Copy the preliminary brief above and paste it into the inquiry form. Add route logs, load distribution, pack voltage range, BMS permissions, motor/drive data and envelope drawings. Engineering can then review the scope, prototype tests and project-specific schedule.